As seen in Australian Property Investor (API) Magazine
Western Australia’s significant rent price growth, relatively low house prices and the potential for strong yields, have caught the eye of investors in recent years. While a lot of interest has focused on Perth, regional areas have also attracted attention.
This month, we’ve looked at the performance of the regional centres over the past year. I remind investors that conditions will vary within the regional centres, and if you are looking to invest you should speak to a local REIWA member for insights into the best performing suburbs, vacancy rates, and tenant demand.
Median house sale price growth
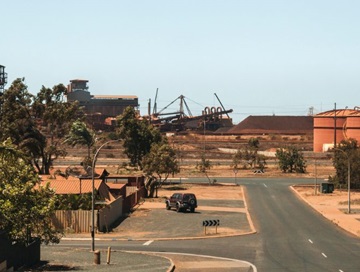
Over the past year Geraldton was the top performing regional centre for price growth, with its median house price rising 26.8 per cent to $520,000. Looking longer term, Port Hedland has experienced dramatic growth, with a 125.1 per cent increase in its median house price over five years. However, it was the only regional centre to record a decline in the past year.
Median selling days
Houses are selling very quickly in all regions, with the exception of Port Hedland. Esperance recorded the shortest time on market with a median of 11 days, followed by Albany with 12 days. Most regions have seen days on market decrease significantly over the past five years.
| | Year to June 2025 | Year to June 2024 | Year to June 2020 | 1-year change | 5-year change |
| Albany | 12 | 14 | 83 | -2 | -71 |
| Broome | 20 | 16 | 24 | -6 | -4 |
| Bunbury | 17 | 21 | 80 | +5 | -63 |
| Busselton | 17 | 13 | 81 | +4 | -64 |
| Esperance | 11 | 16 | 102 | -5 | -91 |
| Geraldton | 18 | 16 | 69 | +2 | -51 |
| Kalgoorlie-Boulder | 24 | 33 | 88 | -9 | -64 |
| Karratha | 16 | 23 | 37 | -7 | -21 |
| Port Hedland | 39 | 23 | 50 | +16 | -11 |
| Greater Perth | 14 | 9 | 49 | +5 | -35 |
Median weekly rent
Regional rents have increased strongly over the past five years, with many regional centres coming off low bases following WA’s extended property market downturn. Broome, Port Hedland and Karratha have recorded the strongest growth.
In addition to population growth, in many regional centres, demand from corporates and government departments seeking to house staff has boosted competition for private rental properties and helped drive price growth.
Karratha was the top performer in the year to June 2025, with its median rent increasing 30.0 per cent to $1,300 per week.
| | 3-months to June 2025 | 3-months to June 2024 | 3-months to June 2020 | 1-year change | 5-year change |
| Albany | $590 | $495 | $350 | +19.2% | +68.6% |
| Broome | $1,200 | $1,200 | $545 | +0.0% | +120.2% |
| Bunbury | $650 | $600 | $350 | +8.3% | +85.7% |
| Busselton | $780 | $700 | $400 | +11.4% | +95.0% |
| Esperance | $470 | $550 | $340 | -14.5% | +38.2% |
| Geraldton | $550 | $500 | $290 | +10.0% | +89.7% |
| Kalgoorlie-Boulder | $650 | $600 | $370 | +8.3% | +75.7% |
| Karratha | $1,300 | $1,000 | $620 | +30.0% | +109.7% |
| Port Hedland | $950 | $950 | $448 | +0.0% | +112.3% |
| Greater Perth | $680 | $650 | $370 | +4.6% | +83.8% |
Median leasing days
Houses are leasing in around two to three weeks in most regional centres, with Port Hedland the exception. Esperance and Karratha recorded the fastest median leasing time at 15 days.
| | 3-months to June 2025 | 3-months to June 2024 | 3-months to June 2020 | 1-year change | 5-year change |
| Albany | 22 | 20 | 34 | +2 | -12 |
| Broome | 20 | 25 | 40 | -5 | -20 |
| Bunbury | 25 | -22 | 33 | +3 | -8 |
| Busselton | 19 | 20 | 23 | -1 | -4 |
| Esperance | 15 | 13 | 38 | +2 | -23 |
| Geraldton | 25 | 22 | 41 | +3 | -16 |
| Kalgoorlie-Boulder | 25 | 29 | 37 | -4 | -12 |
| Karratha | 15 | 31 | 21 | -16 | -6 |
| Port Hedland | 36 | 42 | 37 | -6 | -1 |
| Greater Perth | 17 | 17 | 27 | +0 | -10 |
Rental yield
Rental yields increased in four regional centres over the past 12 months. Karratha currently offers the strongest yield at 10.7 per cent, followed by Port Hedland, Kalgoorlie-Boulder and Broome.
| | June 2025 | June 2024 | June 2020 | 1-year change | 5-year change |
| Albany | 4.9% | 4.8% | 4.9% | +0.1pp | -0.1pp |
| Broome | 8.2% | 9.4% | 6.4% | -1.2pp | +3.0pp |
| Bunbury | 5.4% | 6.0% | 5.2% | -0.6pp | +0.8pp |
| Busselton | 4.5% | 4.6% | 4.2% | -0.1pp | +0.3pp |
| Esperance | 4.8% | 6.4% | 5.7% | -1.6pp | +0.7pp |
| Geraldton | 5.5% | 6.3% | 5.7% | -0.8pp | +0.7pp |
| Kalgoorlie-Boulder | 8.5% | 8.4% | 7.1% | +0.1pp | +1.3pp |
| Karratha | 10.7% | 9.5% | 7.5% | +1.3pp | +2.0pp |
| Port Hedland | 9.6% | 9.1% | 10.2% | +0.6pp | -1.2pp |
| Greater Perth | 4.4% | 5.0% | 4.0% | -0.6pp | +1.0pp |
WA’s regions are currently seeing a lot of infrastructure investment from large corporations and the state government. This is likely to continue to drive employment opportunities and population growth, which will support ongoing demand for rental properties.
However, the State Government is increasing its investment in Government Regional Officer Housing, which could slightly soften demand in the private rental market in the longer term.
Investors, particularly Eastern States investors, should research each regional market carefully and make their decisions based on their personal situations and long-term goals.
Suzanne Brown
REIWA President


1d20b52a-a5ac-4b74-b9f7-28af29faa21a.tmb-rcarousel.jpg?sfvrsn=98acf007_1)