The top performing northern suburbs revealed
30 November 2023"Whether you want to buy, invest, or brag about your suburb at the next family dinner, you'll find a snapshot of the action."
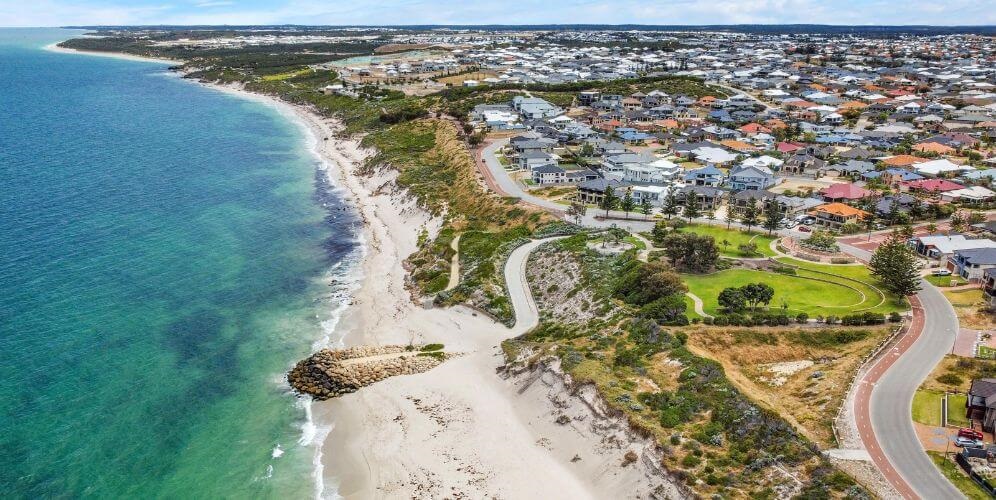
To fuel the ongoing debate between buying and investing north or south of the river, REIWA Research has run the data to find the top performing suburbs north of the river.
Whether you want to buy, invest, or brag about your suburb at the next family dinner, you'll find a snapshot of the action below.
For a review of the top performing suburbs south of the river, read last week's article.
House price growth
The north-eastern corridor shone when it came to house price growth, with the top four suburbs on the list all recording increases over 14 per cent. Bullsbrook took the lead with a 23 per cent increase in home values to $492,000, significantly higher than the 5.6 per cent growth recorded for the greater Perth market.
Middle Swan, Stratton and Lockridge had growth of 16.1 per cent, 15.6 per cent and 14.2 per cent respectively.
Seven of the suburbs were under Perth’s median of $570,000. While the average of the top 10 northern suburbs median house prices is similar to the greater Perth median, the average top 10 southern suburbs price was 29 per cent lower than the greater Perth median.
Top 10 suburbs for house price growth
| SUBURB | ANNUAL MEDIAN HOUSE PRICE (SEP 2023) | ANNUAL HOUSE PRICE GROWTH | SELLING DAYS (Q3 2023) | |
| 1 | Bullsbrook | $492,000 | 23.0% | 11 |
| 2 | Middle Swan | $418,000 | 16.1% | 7 |
| 3 | Stratton | $416,000 | 15.6% | 8 |
| 4 | Lockridge | $411,000 | 14.2% | 7 |
| 5 | Kallaroo | $937,500 | 13.6% | 10 |
| 6 | Merriwa | $460,000 | 13.2% | 10 |
| 7 | Clarkson | $498,500 | 13.0% | 7 |
| 8 | Trigg | $1,690,000 | 12.7% | 22 |
| 9 | Osborne Park | $622,500 | 12.0% | 10 |
| 10 | Eglinton | $502,750 | 11.7% | 12 |
Source: REIWA. Houses, minimum 28 sales in year to Sep 2022 and to Sep 2023, land size < 1 HA, as at 19 Oct 2023.
Fastest selling
Homes in the northern suburbs sold quickly over the year to September, with all of the top 10 suburbs selling in a week or less.
Shenton Park was the fastest selling suburb with a median time on market of four days, only one day more than Perth’s fastest selling suburb Seville Grove. While Shenton Park saw a decline in median house price over the year, it should be noted that this followed a significant increase in the years prior. Demand remains high, which is reflected in the speed of sales.
Six of the suburbs were under the greater Perth median house price of $570,000, highlighting the speed at which buyers acted when they saw value.
Top 10 fastest selling suburbs
| SUBURB | ANNUAL MEDIAN HOUSE PRICE (SEP 2023) | ANNUAL HOUSE PRICE GROWTH | SELLING DAYS (Q3 2023) | |
| 1 | Shenton Park | $1,580,000 | -4.3% | 4 |
| 2 | Dayton | $500,000 | 7.0% | 5 |
| 3 | Carramar | $650,000 | 9.2% | 6 |
| 4 | Mirrabooka | $445,500 | 8.7% | 6 |
| 5 | Caversham | $566,000 | 7.8% | 6 |
| 6 | Eden Hill | $492,500 | 5.7% | 6 |
| 7 | Ridgewood | $450,000 | 4.7% | 6 |
| 8 | Churchlands | $1,596,250 | 0.7% | 6 |
| 9 | Bedford | $836,667 | 10.8% | 7 |
| 10 | Butler | $460,000 | 9.5% | 7 |
Source: REIWA. Houses, minimum 28 sales in year to Sep 2023, land size < 1 HA, as at 19 Oct 2023.
Rent price growth
Quinns Rocks was the top performer among the northern suburbs, with its median weekly house rent price increasing 35.4 per cent to $650.
The inner-city suburb of Mount Lawley and coastal Floreat have performed well for investors, with growth of 33.3 per cent and 25 per cent respectively. While they are the most expensive suburbs on the list in terms of rent price, their proximity to the city, the beach and other amenities makes them appealing suburbs for tenants willing to spend the extra money to find a home that suits their lifestyle.
Seven of the suburbs sat above the greater Perth median house price rent of $600 per week.
Top 10 suburbs for rent price growth
| SUBURB | ANNUAL MEDIAN HOUSE PRICE (SEP 2023) | ANNUAL HOUSE PRICE GROWTH | SELLING DAYS (Q3 2023) | MEDIAN WEEKLY HOUSE RENT (Q3 2023) | LEASING DAYS (Q3 2023) | ANNUAL RENT PRICE GROWTH (HOUSE) | RENTAL YIELD (SEP 2023) | |
| 1 | Quinns Rocks | $612,000 | 6.2% | 8 | $650 | 17 | 35.4% | 5.5% |
| 2 | Mount Lawley | $1,200,000 | -0.8% | 18 | $800 | 16 | 33.3% | 3.5% |
| 3 | Balga | $397,000 | 9.1% | 8 | $548 | 16 | 30.4% | 7.2% |
| 4 | Dayton | $500,000 | 7.0% | 5 | $600 | 14 | 26.3% | 6.2% |
| 5 | Floreat | $1,735,000 | -4.7% | 16 | $1,000 | 22 | 25.0% | 3.0% |
| 6 | Greenwood | $660,000 | 6.5% | 14 | $650 | 11 | 24.4% | 5.1% |
| 7 | Nollamara | $450,000 | 4.8% | 9 | $550 | 12 | 22.2% | 6.4% |
| 8 | Brabham | $524,000 | 5.3% | 10 | $610 | 12 | 22.0% | 6.1% |
| 9 | Dianella | $720,000 | 2.0% | 14 | $610 | 14 | 22.0% | 4.4% |
| 10 | Beechboro | $472,000 | 7.3% | 10 | $550 | 13 | 20.9% | 6.1% |
Source: REIWA. Houses, minimum 15 leases in 3-months to Sep 2022 and to Sep 2023, as at 19 Oct 2023.
Fastest leasing
Vacancies in the top 10 northern suburbs filled quickly in the year to September. All had a median leasing time of less than two weeks.
Greenwood, Yokine and Mosman Park were the fastest leasing suburbs of the list, with vacancies filled in 11 days.
Distance to the city may have been a consideration for tenants, with six of the top fastest leasing suburbs located less than 15 kilometres from the CBD.
Top 10 fastest leasing suburbs
| SUBURB | ANNUAL MEDIAN HOUSE PRICE (SEP 2023) | ANNUAL HOUSE PRICE GROWTH | SELLING DAYS (Q3 2023) | MEDIAN WEEKLY HOUSE RENT (Q3 2023) | LEASING DAYS (Q3 2023) | ANNUAL RENT GROWTH (HOUSE) | RENTAL YIELD (SEP 2023) | |
| 1 | Greenwood | $660,000 | 6.5% | 14 | $650 | 11 | 24.4% | 5.1% |
| 2 | Yokine | $720,000 | 4.0% | 13 | $600 | 11 | 9.1% | 4.3% |
| 3 | Mosman Park | $1,830,000 | 4.3% | 15 | $900 | 11 | -25.0% | 2.6% |
| 4 | Morley | $575,000 | 4.5% | 14 | $570 | 12 | 11.8% | 5.2% |
| 5 | Nollamara | $450,000 | 4.8% | 9 | $550 | 12 | 22.2% | 6.4% |
| 6 | Brabham | $524,000 | 5.3% | 10 | $610 | 12 | 22.0% | 6.1% |
| 7 | Padbury | $700,000 | 3.7% | 9 | $650 | 12 | 18.2% | 4.8% |
| 8 | Ballajura | $540,000 | 11.3% | 9 | $583 | 12 | 26.6% | 5.6% |
| 9 | Bassendean | $602,000 | 4.2% | 14 | $600 | 12 | 13.2% | 5.2% |
| 10 | Beechboro | $472,000 | 7.3% | 10 | $550 | 13 | 20.9% | 6.1% |
Source: REIWA. Houses, minimum 15 leases in 3-months to Sep 2023, as at 19 Oct 2023.
Rental yield
Similar to the top southern suburbs, all of the top 10 northern suburbs for rental yield had median house prices below the greater Perth median and featured a rental yield above 6 per cent.
Balga recorded the northern suburbs’ and Perth’s highest rental yield at 7.2 per cent. The suburb had a median house price of $397,000 and a median house rent price of $548 per week, making it the most affordable suburb on the list for both property owners and tenants. The suburb is appealing for young professionals and families due to its proximity to the city, which is only 13 kilometres away.
Nine of the suburbs had a house rent price at or below greater Perth’s September median.
Top 10 suburbs by rental yield
| SUBURB | ANNUAL MEDIAN HOUSE PRICE (SEP 2023) | ANNUAL HOUSE PRICE GROWTH | SELLING DAYS (Q3 2023) | MEDIAN WEEKLY HOUSE RENT (Q3 2023) | LEASING DAYS (Q3 2023) | ANNUAL RENT GROWTH (HOUSE) | RENTAL YIELD (SEP 2023) | |
| 1 | Balga | $397,000 | 9.1% | 8 | $548 | 16 | 30.4% | 7.2% |
| 2 | Nollamara | $450,000 | 4.8% | 9 | $550 | 12 | 22.2% | 6.4% |
| 3 | Dayton | $500,000 | 7.0% | 5 | $600 | 14 | 26.3% | 6.2% |
| 4 | Butler | $460,000 | 9.5% | 7 | $550 | 16 | 14.6% | 6.2% |
| 5 | Eglinton | $502,750 | 11.7% | 12 | $595 | 19 | 19.6% | 6.2% |
| 6 | Beechboro | $472,000 | 7.3% | 10 | $550 | 13 | 20.9% | 6.1% |
| 7 | Brabham | $524,000 | 5.3% | 10 | $610 | 12 | 22.0% | 6.1% |
| 8 | Banksia Grove | $495,000 | 11.2% | 9 | $570 | 15 | 8.6% | 6.0% |
| 9 | Alkimos | $500,000 | 6.4% | 7 | $575 | 14 | 15.0% | 6.0% |
| 10 | Ellenbrook | $480,000 | 6.7% | 9 | $550 | 14 | 14.6% | 6.0% |
Source: REIWA. Houses, minimum 28 sales in year to Sep 2023, land size < 1 HA, minimum 15 leases in 3-months to Sep 2023, as at 19 Oct 2023.
Standout suburbs
Eight suburbs made appearances across multiple lists, highlighting their investment potential.
Securing a place on three lists were Dayton: second fastest selling, third for rental yields and fourth for rent price growth; Nollamara: second for rental yields, fifth fastest leasing and seventh for rent price growth; Brabham: sixth for fastest leasing, seventh for rental yields and eighth for rent price growth; and Beechboro: sixth place for rental yield, and tenth for fastest leasing and rent price growth.
Balga, Butler, Eglinton and Greenwood also placed on two lists.
East v west: a new divide
While we have generally focused on the divide between north and south, we can also look at comparisons between the east and west.
Last week, we saw that the south-eastern corridor performed strongly in the rental market. The trend is similar in Perth’s north. More north-eastern suburbs made the top 10 for rent price growth (eight), fastest leasing (eight) and rental yields (seven).
When looking at the sales market, it’s a slightly different story. Results were more mixed, with more eastern suburbs making the top 10 for fastest selling (six), while more western suburbs made the list for price growth (six). Interestingly, the top four suburbs for house price growth were eastern suburbs.
When it comes to the big decision on where to buy or invest, personal circumstances are the deciding factor. Proximity to schools or the workplace might make the decision for you as a home owner, while yield or capital growth may be motivating factors if you’re looking to invest. It is important to always consider your own needs before making the leap into the property market.
.tmb-rcarousel.jpg?sfvrsn=24ed8b20_1)





.tmb-rcarousel.png?sfvrsn=3619a769_1)
