The Perth property market top performers for 2023
25 January 2024"REIWA CEO Cath Hart said while the Perth market had weathered the ongoing interest rate rises in 2023, affordability was still a focus for buyers."
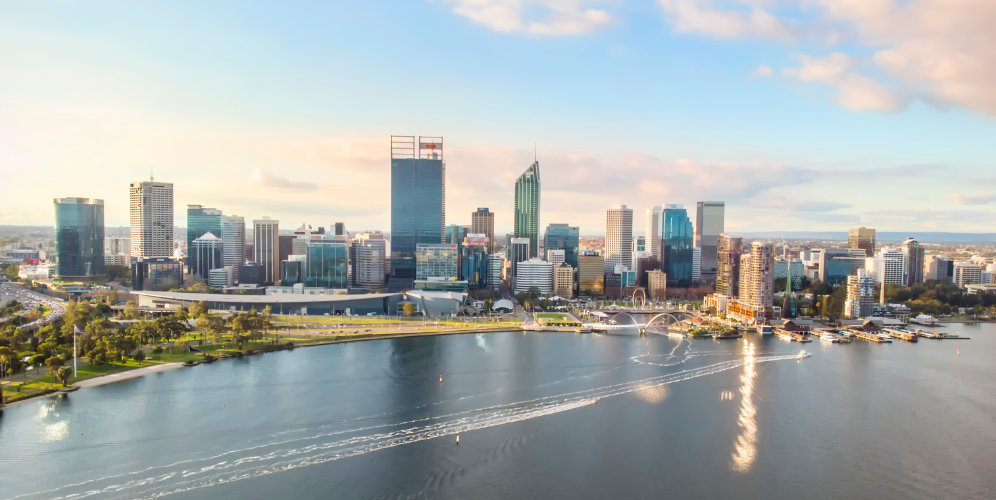
Despite a perceived shortage of homes for sale, the Perth property market performed well in 2023, with 53,895 settled sales over houses, units and land.
This is just 3.3 per cent lower than 2022 and the gap will close as more properties settle in the next few months.
While the number of sales declined slightly, the total value of sales was $34,847,370,352, which is 1.7 per cent higher than 2022.
REIWA CEO Cath Hart said the increase in total value reflected the increase in sale prices across Perth.
“2023 was a record-breaking year for the market, with the median house sale price reaching a new high of $590,000,” she said.
“And while the median unit sale price was stagnant for most of 2023, it recorded 2.0 per cent growth in the last quarter of the year to settle at $408,000.
“This is just 0.7 per cent higher than at the end of 2022 but more growth is expected in 2024.”
Bullsbrook recorded the highest price growth for houses, with its median house sale price increasing 33.3 per cent to $530,000.
Ms Hart said while the Perth market had weathered the ongoing interest rate rises in 2023, affordability was still a focus for buyers and this was reflected in the Top 10 for house sales.
“Shelley and Woodbridge are the only suburbs on the list with a median house sale price above the Perth median, and Shelley is the only suburb with a median house sale price over $1 million,” she said.
“The remaining eight suburbs all have median house sale prices below $530,000, with Armadale the most affordable at $380,000.
“Rising interest rates and reduced borrowing capacity over the past year have driven interest in the lower-priced suburbs and competition for homes in these areas has seen them record extremely strong price growth.”
In the unit market, West Leederville was the top performer, with its median sale price rising 31.6 per cent to $500,000. Erskine also recorded growth over 30 per cent.
Notably, seven of the suburbs in the Top 10 for unit sale price growth were under the median unit price.
“Unit prices have been much slower to respond to market conditions than houses, with many buyers preferring a house to a unit,” Ms Hart said.
“However, our members are reporting the overall demand for property, and particularly the strong motivation to exit the challenging rental market, is seeing greater demand for units. Units are generally more affordable than houses, which helps people put a foot on the property ladder in a rising market. This is helping drive price growth.”
Ms Hart said 2023 saw houses sell incredibly quickly, with a new monthly record of a median eight days on market set in October and November.
“Affordability also came to the fore in the fastest selling list, with all ten suburbs recording a median house sale price below $500,000,” she said.
“We saw this trend emerge towards the end of 2022 and it’s carried through into 2023.
“Buyers are clearly acting quickly when they see value. And while there has been a lot of discussion about Eastern States buyers snapping up bargains in some Perth suburbs, local buyers were also extremely active.”
The fastest selling suburb for houses was Leda, where homes sold in a median of four days.
Nollamara was the fastest selling suburb for units, with a median eight days on market for 2023.
“Over 2023 we saw the median time on market for units decreased significantly, also reflecting the growing demand for units,” Ms Hart said.
Top 10 suburbs for median price growth (houses)
| SUBURB | ANNUAL HOUSE SALE PRICE | CHANGE IN ANNUAL PRICE | MEDIAN SELLING DAYS | |
| 1 | Bullsbrook | $530,000 | 33.3% | 11 |
| 2 | Shelley | $1,175,000 | 30.9% | 15 |
| 3 | Midvale | $460,000 | 27.8% | 14 |
| 4 | Kenwick | $470,000 | 25.3% | 11 |
| 5 | Cooloongup | $487,750 | 25.1% | 5 |
| 6 | Armadale | $380,000 | 23.4% | 7 |
| 7 | Woodbridge | $800,000 | 23.1% | 19 |
| 8 | Parmelia | $430,000 | 22.9% | 7 |
| 9 | Camillo | $401,000 | 22.6% | 7 |
| 10 | Swan View | $512,500 | 22.0% | 10 |
Top 10 suburbs for median price growth (units)
| SUBURB | Annual UNIT SALE PRICE | CHANGE IN ANNUAL UNIT PRICE | MEDIAN SELLING DAYS | |
| 1 | West Leederville | $500,000 | 31.6% | 13 |
| 2 | Erskine | $432,500 | 31.1% | 12 |
| 3 | Balga | $326,000 | 19.5% | 12 |
| 4 | Baldivis | $390,000 | 18.4% | 9 |
| 5 | Nedlands | $745,500 | 18.3% | 13 |
| 6 | Orelia | $208,000 | 15.6% | 6 |
| 7 | Armadale | $300,000 | 15.4% | 7 |
| 8 | Wembley | $312,000 | 15.3% | 14 |
| 9 | Nollamara | $395,000 | 15.2% | 9 |
| 10 | Morley | $393,500 | 14.6% | 13 |
Fastest selling suburbs (houses)
| SUBURB | ANNUAL HOUSE SALE PRICE | CHANGE IN ANNUAL HOUSE PRICE | SELLING DAYS | |
| 1 | Leda | $450,000 | 16.9% | 4 |
| 2 | Cooloongup | $487,750 | 25.1% | 5 |
| 3 | Seville Grove | $473,750 | 19.0% | 5 |
| 4 | Orelia | $417,500 | 18.6% | 6 |
| 5 | Brookdale | $415,000 | 20.3% | 6 |
| 6 | Greenfields | $430,000 | 17.7% | 6 |
| 7 | Hillman | $425,000 | 16.4% | 6 |
| 8 | Karnup | $487,500 | 10.5% | 6 |
| 9 | Merriwa | $487,500 | 14.7% | 6 |
| 10 | Statton | $441,750 | 19.4% | 6 |
Fastest selling suburbs (units)
| SUBURB | ANNUAL UNIT SALE PRICE | CHANGE IN ANNUAL UNIT PRICE | SELLING DAYS | |
| 1 | Nollamara | $395,500 | 15.2% | 8 |
| 2 | Balga | $326,000 | 19.5% | 9 |
| 3 | Orelia | $208,000 | 15.6% | 9 |
| 4 | Westminster | $360,000 | 16.1% | 10 |
| 5 | Balcatta | $432,500 | 6.8% | 10 |
| 6 | Joondanna | $410,000 | 6.5% | 10 |
| 7 | Palmyra | $493,500 | 13.5% | 11 |
| 8 | Tuart Hill | $380,000 | 10.1% | 11 |
| 9 | Bayswater | $277,500 | 11.0% | 12 |
| 10 | Shoalwater | $263,063 | 5.2% | 12 |
Perth rent market
Records were also set in the rental market during 2023.
“Demand has continued to be high, and coupled with low supply, has seen rent prices set new records over the past 12 months,” Ms Hart said.
“The median weekly rent at the end of December 2023 was $620 for houses and $570 for units.
“The vacancy rate was 0.7 per cent for 10 of the past 12 months.
“Given ongoing stock shortages and sustained demand from new interstate and overseas arrivals, we expect these trends to continue into 2024.”
Ms Hart said Perth’s relatively affordable housing and strong rental market has seen Perth become the focus of Eastern States investors.
“The potential for high yields in certain areas has drawn the eye of east coast investors,” she said.
“With local investors continuing to leave the market, this has been beneficial in maintaining rental supply in a very tight market.
“As property prices rise and yields decline, Eastern States investors will move on to the next hot spot.”
While houses out-performed units in terms of median sale price growth, units came to the fore for rental yield according to www.reiwa.com data.
“The Top 10 suburbs for units all recorded yields above 7.4 per cent, outshining the number one suburb for houses at 6.4 per cent,” Ms Hart said.
“This is likely to be a reflection of the lower sale price growth of the unit market compared to houses in a rising rent environment.
“Perth does offer affordable entry points and good opportunities for investors. The suburbs in the Top 10 list for houses have median sale prices below $500,000, while the suburbs in the Top 10 for units have median sale prices below $355,000.”
Medina topped the list for houses, providing a yield of 6.4 per cent based on a median house sale price of $360,000 and median weekly rent price of $440.
When it came to units, Orelia offered a high yield of 9 per cent based on its median unit sale price of $208,000 and median weekly rent price of $360.
Swanbourne recorded the most rent price growth for houses, with its median rent rising a staggering 57.5 per cent over the year to $1,575.
Mosman Park recorded the most rent price growth for units. Its median rent was $475, 35.7 per cent higher than at the end of 2022.
Properties continued to rent quickly in 2023 with the median leasing time for Perth hovering around two weeks.
Coogee was the fastest leasing suburb for houses, with properties leasing in a median of 10 days. Glendalough was the fastest leasing suburb for units with vacancies filled in a median of nine days.
Top 10 suburbs for rental yield (houses)
| SUBURB | 2022-23 MEDIAN WEEKLY HOUSE RENT | ANNUAL MEDIAN HOUSE SALES PRICE | RENTAL YIELD | |
| 1 | Medina | $440 | $360,000 | 6.4% |
| 2 | Brookdale | $500 | $415,000 | 6.3% |
| 3 | Langford | $535 | $445,000 | 6.3% |
| 4 | Armadale | $450 | $380,000 | 6.2% |
| 5 | Cannington | $530 | $450,000 | 6.1% |
| 6 | Queens Park | $580 | $495,500 | 6.1% |
| 7 | Balga | $500 | $427,000 | 6.1% |
| 8 | Mandurah | $450 | $385,000 | 6.1% |
| 9 | Maddington | $500 | $430,000 | 6.0% |
| 10 | Greenfields | $500 | $430,000 | 6.0% |
Top 10 suburbs for rental yield (units)
| SUBURB | 2022-23 MEDIAN WEEKLY UNIT RENT | ANNUAL MEDIAN UNIT SALE PRICE | RENTAL YIELD | |
| 1 | Orelia | $360 | $208,000 | 9.0% |
| 2 | Bayswater | $470 | $280,000 | 8.7% |
| 3 | Glendalough | $450 | $291,000 | 8.0% |
| 4 | Balga | $500 | $327,000 | 8.0% |
| 5 | Hamilton Hill | $510 | $340,000 | 7.8% |
| 6 | Gosnells | $420 | $284,000 | 7.7% |
| 7 | Wembley | $450 | $311,000 | 7.5% |
| 8 | Armadale | $430 | $300,000 | 7.5% |
| 9 | Midland | $450 | $315,000 | 7.4% |
| 10 | Cannington | $505 | $355,000 | 7.4% |
Top 10 suburbs for rent price growth (houses)
| SUBURB | 2022-23 MEDIAN WEEKLY HOUSE RENT | ANNUAL CHANGE IN HOUSE RENT | MEDIAN LEASING DAYS | |
| 1 | Swanbourne | $1,575 | 57.5% | 21 |
| 2 | Langford | $535 | 33.8% | 11 |
| 3 | Manning | $738 | 32.3% | 14 |
| 4 | Shelley | $750 | 31.0% | 15 |
| 5 | Joondanna | $650 | 30.0% | 15 |
| 6 | Mount Lawley | $770 | 28.3% | 17 |
| 7 | Seville Grove | $540 | 27.1% | 13 |
| 8 | Ardross | $850 | 26.9% | 19 |
| 9 | Wembley | $850 | 26.4% | 16 |
| 10 | Burswood | $695 | 26.4% | 20 |
Top 10 suburbs for rent price growth (units)
| SUBURB | 2022-23 MEDIAN WEEKLY UNIT RENT | ANNUAL CHANGE IN UNIT RENT | MEDIAN LEASING DAYS | |
| 1 | Mosman Park | $475 | 35.7% | 14 |
| 2 | Doubleview | $620 | 34.8% | 14 |
| 3 | Attadale | $570 | 29.5% | 16 |
| 4 | Wembley | $450 | 28.6% | 13 |
| 5 | East Victoria Park | $550 | 27.9% | 14 |
| 6 | Hamilton Hill | $510 | 27.5% | 10 |
| 7 | Crawley | $500 | 26.6% | 13 |
| 8 | Kewdale | $500 | 25.0% | 15 |
| 9 | Glendalough | $450 | 25.0% | 10 |
| 10 | Inglewood | $460 | 22.7% | 14 |
Fastest leasing suburbs (houses)
| SUBURB | 2022-23 MEDIAN WEEKLY HOUSE RENT | ANNUAL CHANGE IN HOUSE RENT | MEDIAN LEASING DAYS | |
| 1 | Coogee | $780 | 20.0% | 10 |
| 2 | Langford | $535 | 33.8% | 11 |
| 3 | Pearsall | $580 | 12.6% | 11 |
| 4 | Yangebup | $573 | 14.5% | 11 |
| 5 | Coolbellup | $530 | 17.8% | 12 |
| 6 | Ferndale | $500 | 16.3% | 12 |
| 7 | Hocking | $600 | 13.2% | 12 |
| 8 | Thornlie | $550 | 22.2% | 12 |
| 9 | Tuart Hill | $550 | 12.2% | 12 |
| 10 | Darch | $638 | 9.4% | 12 |
Fastest leasing suburbs (units)
| SUBURB | 2022-23 MEDIAN WEEKLY UNIT RENT | ANNUAL CHANGE IN UNIT RENT | MEDIAN LEASING DAYS | |
| 1 | Coolbellup | $450 | 18.4% | 9 |
| 2 | Spearwood | $480 | 14.3% | 9 |
| 3 | Hamilton Hill | $510 | 27.5% | 10 |
| 4 | Glendalough | $450 | 25.0% | 10 |
| 5 | Gosnells | $420 | 20.0% | 10 |
| 6 | Westminster | $500 | 13.6% | 10 |
| 7 | Joondanna | $500 | 11.1% | 11 |
| 8 | Leederville | $600 | 20.0% | 11 |
| 9 | Nollamara | $530 | 17.8% | 11 |
| 10 | Palmyra | $510 | 10.9% | 11 |
.tmb-rcarousel.jpg?sfvrsn=94ec25f9_1)



.tmb-rcarousel.jpg?sfvrsn=24ed8b20_1)
