The Perth property market's top performers for 2023-24
18 July 2024"Perth’s top performing suburb recorded a 40.9 per cent increase in its median house sale price in 2023-24."
The Perth property market performed well in 2023-24, with 54,307 preliminary settled sales of houses, units and land for the year.
Despite a perceived shortage of homes for sale, the settled sales result is currently just 3.9 per cent lower than FY2022-23. The gap will close as more properties settle in the next few months, with REIWA data showing the number of sales for 2023-24 will likely exceed the previous financial year.
REIWA CEO Cath Hart said while active listings remained low throughout 2023-24, newly-listed properties still came to the market in reasonable numbers.
“People are still selling, but homes are being snapped up in record timeframes so the number of properties advertised at any time appears low,” she said.
While the number of sales is currently lower than 2022-23, the preliminary total value of sales is $39,564,740,679, which is 13.2 per cent higher.
Ms Hart said the increase in total value reflected the increase in sale prices across Perth.
“While volumes were slightly down, the total value of property transactions was nearly $40 billion for the year which reflects the sustained price increases we’ve seen in the WA market,” she said.
“The median house sale price set a new record month after month over the financial year, and is now $665,000 for the year to June 2024. This is 18.8 per cent higher than at the end of the 2022-23 financial year.
“The median unit sale price increased 11.3 per cent year-on-year to reach $445,000, just $5,000 below the previous record of $450,000 in 2014. We expect this record to be broken in the next few months.”
Viveash recorded the highest price growth for houses, with its median house sale price increasing 40.9 per cent over 2023-24 to $620,000.
“Affordability remains a focus for buyers and this is reflected in the make up of the Top 10 suburbs for house price growth,” Ms Hart said.
“The majority have a median sale price below Perth’s median and only two have a median house sale price over $1million.
“It indicates strong demand for suburbs in more affordable price brackets. Demand is also reflected in their selling times. The more affordable suburbs on the list have a median time on market that is nearly half that of the suburbs with a median over $1 million.”
In the unit market, Cottesloe was the top performer, with its median sale price rising 50.9 per cent to $1,200,000. Bayswater recorded growth of more than 40 per cent.
Like the Top 10 list for house price growth, seven of the suburbs in the Top 10 for units have a median sale price under Perth’s median unit price.
“While the unit market was slower to respond to market conditions over most of 2023, in 2024 we have seen demand and price growth accelerate,” Ms Hart said.
“The overall demand for property, and particularly the strong motivation to exit the challenging rental market, has seen demand for units increase. Units are generally more affordable than houses, which helps people put a foot on the property ladder in a rising market. This is helping drive price growth in the unit market.”
2023-24 saw houses sell incredibly quickly, with a new monthly record of a median eight days on market set in October and November. This was sustained throughout the first half of 2024.
“Affordability also came to the fore in the fastest selling list, with all ten suburbs recording a median house sale price below $550,000,” Ms Hart said.
“While there is clearly the appetite for, and ability to, buy property in Perth, price is important and buyers continue to act quickly when they see value.
“Houses sold in a median of less than a week for all the suburbs on the list. High demand also saw these suburbs record strong price growth.”
The fastest selling suburb for houses was Cooloongup, where homes sold in a median of five days.
The demand for units in 2024 saw a new record median time on market of nine days set in February. Mount Hawthorn was the fastest selling suburb for units, with a median six days on market for 2023-24.
TOP 10 SUBURBS FOR MEDIAN PRICE GROWTH (HOUSES)
Scroll sideways
| SUBURB | ANNUAL HOUSE SALE PRICE | CHANGE IN ANNUAL HOUSE PRICE | ANNUAL MEDIAN SELLING DAYS | |
| 1 | Viveash | $620,000 | 40.9% | 7 |
| 2 | Hillman | $537,000 | 39.5% | 5 |
| 3 | Armadale | $460,000 | 39.4% | 7 |
| 4 | Midvale | $515,000 | 38.3% | 8 |
| 5 | Shelley | $1,269,999 | 38.0% | 15 |
| 6 | Kallaroo | $1,220,500 | 37.1% | 14 |
| 7 | Kelmscott | $503,600 | 35.3% | 8 |
| 8 | Henley Brook | $735,000 | 35.2% | 9 |
| 9 | Lockridge | $513,000 | 35.0% | 8 |
| 10 | Haynes | $605,000 | 34.7% | 8 |
TOP 10 SUBURBS FOR MEDIAN PRICE GROWTH (UNITS)
Scroll sideways
| SUBURB | ANNUAL UNIT SALE PRICE | CHANGE IN ANNUAL UNIT PRICE | ANNUAL MEDIAN SELLING DAYS | |
| 1 | Cottesloe | $1,200,000 | 50.9% | 25 |
| 2 | Bayswater | $350,000 | 44.0% | 8 |
| 3 | Girrawheen | $410,000 | 34.4% | 19 |
| 4 | Rockingham | $408,500 | 30.7% | 13 |
| 5 | Shoalwater | $312,500 | 30.2% | 12 |
| 6 | Mount Hawthorn | $627,500 | 28.6% | 6 |
| 7 | Glendalough | $330,000 | 26.9% | 13 |
| 8 | Armadale | $350,000 | 25.0% | 10 |
| 9 | Morley | $450,000 | 24.8% | 7 |
| 10 | Erskine | $480,000 | 24.7% | 12 |
FASTEST SELLING SUBURBS (HOUSES)
Scroll sideways
| SUBURB | ANNUAL HOUSE SALE PRICE | CHANGE IN ANNUAL HOUSE PRICE | ANNUAL MEDIAN SELLING DAYS | |
| 1 | Cooloongup | $550,000 | 30.3% | 5 |
| 2 | Leda | $520,000 | 26.8% | 5 |
| 3 | Hillman | $537,000 | 39.5% | 5 |
| 4 | Orelia | $500,000 | 31.8% | 5 |
| 5 | Huntingdale | $585,000 | 23.2% | 6 |
| 6 | Langford | $515,000 | 19.8% | 6 |
| 7 | Brookdale | $473,000 | 27.0% | 6 |
| 8 | Butler | $550,000 | 23.6% | 6 |
| 9 | Calista | $449,500 | 29.0% | 6 |
| 10 | Camillo | $476,000 | 34.1% | 6 |
FASTEST SELLING SUBURBS (UNITS)
Scroll sideways
| SUBURB | ANNUAL UNIT SALE PRICE | CHANGE IN ANNUAL UNIT PRICE | ANNUAL MEDIAN SELLING DAYS | |
| 1 | Mount Hawthorn | $627,500 | 28.6% | 6 |
| 2 | Balga | $359,000 | 16.6% | 7 |
| 3 | Inglewood | $424,000 | 19.4% | 7 |
| 4 | Morley | $450,000 | 24.8% | 7 |
| 5 | Nollamara | $433,500 | 22.5% | 7 |
| 6 | Orelia | $229,500 | 17.7% | 7 |
| 7 | Palmyra | $545,000 | 19.8% | 7 |
| 8 | Tuart Hill | $430,000 | 24.6% | 7 |
| 9 | Ellenbrook | $377,000 | 21.6% | 8 |
| 10 | Bayswater | $350,000 | 44.0% | 8 |
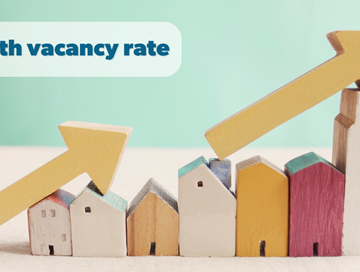
Perth rent market
Records were also set in the rental market during 2023-24.
“Demand remained high. coupled with ongoing low supply which saw rent prices reach new peaks in early 2024,” Ms Hart said.
“There are signs the rental market is beginning to moderate with prices remaining stable since March, sitting at $650 per week for houses and $600 per week for units, at the end of June.
“Along with the stability in rent prices, the number of rental listings has been increasing since February and properties are taking longer to lease, particularly at the higher end of the market.
“These changes are not yet reflected in the vacancy rate, which set a new record low of 0.4 per cent in March and has been 0.5 per cent over the last quarter of the financial year, however if the trend continues we expect the vacancy rate may increase in the second half of 2024.”
Perth’s rising property prices and rent stability saw yields decline slightly in 2023-24.
“This time last year, all the top 10 suburbs for houses recorded yields over 6.0 per cent. This financial year, only the top three had a yield over 6.0 percent,” Ms Hart said.
“Last financial year, the top performing suburb for units had a yield of 9.6 per cent, this year the highest yield was 8.1 per cent.
“That said, the top 10 for houses and units still offer strong yields, with yields between 5 – 8 per cent generally considered to be very good returns.
“Overall, the yield data shows that Perth property still provides an affordable entry point to the property market and good opportunities for investors. The suburbs in the Top 10 list for houses have median sale prices below $575,000, while the suburbs in the Top 10 for units have median sale prices below $392,500.
“There are also some suburbs that appear year-on-year with Brookdale, Cannington, Medina, Armadale and Camillo all in the top 10 for houses for both 2023-24 and 2022-23, while Glendalough, Balga, Bayswater, Belmont, Midland and Wembley also appeared in the top 10 for units both financial years.
Langford topped the list for houses, providing a yield of 6.1 per cent based on a median house sale price of $515,000 and median weekly rent of $600.
When it came to units, Cannington offered a yield of 8.1 per cent based on its median unit sale price of $355,000 and median weekly rent price of $550.
Swanbourne recorded the most rent price growth for houses, with its median weekly rent rising 49.8 per cent over the year to $1,498.
Hamilton Hill recorded the most rent price growth for units. Its median rent was $550 per week, 37.5 per cent higher than at the end of 2022-23.
Properties continued to rent quickly across 2023-24. The median leasing time was around two weeks for most of the financial year, rising to 18 days at the end of June.
Coogee was the fastest leasing suburb for houses, with homes leasing in a median of 10 days. Hamilton Hill was the fastest leasing suburb for units with vacancies filled in a median of eight days.
TOP 10 SUBURBS FOR RENTAL YIELD (HOUSES)
Scroll sideways
| SUBURB | ANNUAL MEDIAN HOUSE RENT | ANNUAL CHANGE HOUSE SALE PRICE | RENTAL YIELD | |
| 1 | Langford | $600 | $515,000 | 6.1% |
| 2 | Brookdale | $550 | $473,000 | 6.0% |
| 3 | Cannington | $565 | $492,500 | 6.0% |
| 4 | Medina | $478 | $420,000 | 5.9% |
| 5 | Armadale | $520 | $460,000 | 5.9% |
| 6 | Balga | $550 | $490,000 | 5.8% |
| 7 | East Cannington | $643 | $575,000 | 5.8% |
| 8 | Queens Park | $623 | $560,000 | 5.8% |
| 9 | Camillo | $528 | $476,000 | 5.8% |
| 10 | Nollamara | $595 | $540,000 | 5.7% |
TOP 10 SUBURBS FOR RENTAL YIELD (UNITS)
Scroll sideways
| SUBURB | ANNUAL MEDIAN UNIT RENT | ANNUAL MEDIAN UNIT SALE PRICE | RENTAL YIELD | |
| 1 | Cannington | $550 | $355,000 | 8.1% |
| 2 | Glendalough | $510 | $330,000 | 8.0% |
| 3 | Balga | $550 | $359,000 | 8.0% |
| 4 | Hamilton Hill | $550 | $365,000 | 7.8% |
| 5 | Bayswater | $520 | $350,000 | 7.7% |
| 6 | Beckenham | $520 | $360,000 | 7.5% |
| 7 | Spearwood | $513 | $355,000 | 7.5% |
| 8 | Belmont | $563 | $392,500 | 7.5% |
| 9 | Midland | $500 | $350,000 | 7.4% |
| 10 | Wembley | $485 | $340,000 | 7.4% |
TOP 10 SUBURBS FOR RENT PRICE GROWTH (HOUSES)
Scroll sideways
| SUBURB | ANNUAL MEDIAN HOUSE RENT | ANNUAL CHANGE IN HOUSE RENT | ANNUAL MEDIAN LEASING DAYS | |
| 1 | Swanbourne | $1,498 | 49.8% | 16 |
| 2 | Burswood | $800 | 39.1% | 22 |
| 3 | Bicton | $800 | 35.6% | 22 |
| 4 | Ardross | $900 | 34.3% | 18 |
| 5 | Langford | $600 | 33.3% | 13 |
| 6 | Kelmscott | $550 | 31.0% | 17 |
| 7 | Coolbellup | $600 | 30.4% | 10 |
| 8 | Haynes | $650 | 30.0% | 20 |
| 9 | Embleton | $650 | 30.0% | 16 |
| 10 | Balcatta | $650 | 30.0% | 14 |
TOP 10 SUBURBS FOR RENT PRICE GROWTH (UNITS)
Scroll sideways
| SUBURB | ANNUAL MEDIAN UNIT RENT | ANNUAL CHANGE IN UNIT RENT | ANNUAL MEDIAN LEASING DAYS | |
| 1 | Hamilton Hill | $550 | 37.5% | 8 |
| 2 | Doubleview | $650 | 30.0% | 13 |
| 3 | East Victoria Park | $580 | 28.9% | 16 |
| 4 | Glendalough | $510 | 28.3% | 12 |
| 5 | Mosman Park | $500 | 28.2% | 14 |
| 6 | Nollamara | $580 | 26.1% | 11 |
| 7 | Yokine | $528 | 25.6% | 12 |
| 8 | South Perth | $600 | 25.0% | 15 |
| 9 | North Perth | $650 | 25.0% | 14 |
| 10 | Midland | $500 | 25.0% | 16 |
FASTEST LEASING SUBURBS (HOUSES)
Scroll sideways
| SUBURB | ANNUAL MEDIAN HOUSE RENT | ANNUAL CHANGE IN HOUSE RENT | ANNUAL MEDIAN LEASING DAYS | |
| 1 | Coogee | $798 | 17.3% | 10 |
| 2 | Coolbellup | $600 | 30.4% | 10 |
| 3 | Lake Coogee | $700 | 11 | |
| 4 | Nollamara | $595 | 24.0% | 11 |
| 5 | Pearsall | $580 | 5.5% | 11 |
| 6 | Wanneroo | $583 | 13.1% | 12 |
| 7 | Balga | $550 | 29.4% | 12 |
| 8 | Bedford | $650 | 18.2% | 12 |
| 9 | Darch | $665 | 10.8% | 12 |
| 10 | Innaloo | $700 | 16.7% | 12 |
FASTEST LEASING SUBURBS (UNITS)
Scroll sideways
| SUBURB | ANNUAL MEDIAN UNIT RENT | ANNUAL CHANGE IN UNIT RENT | ANNUAL MEDIAN LEASING DAYS | |
| 1 | Hamilton Hill | $550 | 37.5% | 8 |
| 2 | Shenton Park | $550 | 14.6% | 9 |
| 3 | Spearwood | $513 | 19.2% | 10 |
| 4 | Westminster | $550 | 19.6% | 10 |
| 5 | Bicton | $530 | 17.8% | 11 |
| 6 | Cannington | $550 | 22.2% | 11 |
| 7 | Coolbellup | $463 | 10.1% | 11 |
| 8 | Innaloo | $650 | 16.1% | 11 |
| 9 | Leederville | $630 | 12.5% | 11 |
| 10 | Nollamara | $580 | 26.1% | 11 |


.tmb-rcarousel.jpg?sfvrsn=94ec25f9_1)